In Spring 2018, the assigned homework from this first lecture is
LE 1.2, p 16: 1-4, 17-22 (put your answer in point-slope form!), 63-66, 76-77,
LE Chap 1 review. p 56: 31-33,
LE 2.1, p 67: 1-5,
And also do the following:
KWS 1.1.1. Assume that the following functions are linear. Linearize the functions (point-slope form!) and then answer the questions.
(a) A function f with slope 30, f(googol) = gazillion. What is f(googol+1)? f(googol+2)? f(googol-1)?
(b) The square root function has slope 1/8 at (4,2). Estimate the square root of 4.1? 4.2? 3.9?
(c) The cube root function has slope 1/12 at (8,2). Estimate the cube root of 8.1? 8.2? 7.9?
A simple idea
The study of science requires an analysis of a variety of functions. A simple idea with deep and profound consequences is to attempt to treat functions as if, within a short interval, the functions were linear. Given a particular point P(x, f(x)) on the graph of the function, we ask, "What is the slope of the function at that point?" In what direction is the function going at that point; how is the function value changing as x changes?This is an ancient question; its answer has powerful applications. We will explore the applications first and then develop the tools to find the "slope" of a function.
The slope of a function
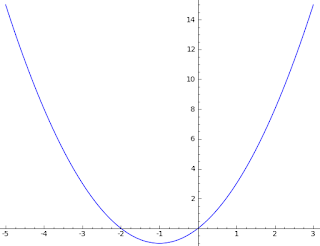
The concept of slope (the ratio of the change in output to the change in input) is constant for linear functions and we attempt to generalize that concept to all functions.For example, take the function
f(x) = x^2 + 2x
and graph the function near the point P(2,8). In the large, the graph y=f(x) of our function should be a parabola.Zoom in on the point $P(2,8)$ and eventually the graph of the parabola begins to look like a straight line.
If we test a few points, for example (2,8) and (2.1, 8.61), we see that this line has slope about 6. So the"slope" of the curve y=x^2+2x at the point (2,8) is "about 6." If the slope of a curve near (2,8) is about 6, then the curve looks like the line y=6x-4. So the function g(x) = 6x-4 is a good approximation for f(x)=x^2+2x near P(2,8). Indeed, we could graph both of those functions in the same window of our calculator.
Here (below) we graph the parabola in blue and the line in red. Notice how closely the line approximates the parabola near the point $P(2,8)$.
(The blue parabola rises just a little above the line at both ends -- it is hard to tell the difference!)
Function slope on a graphing calculator
On a graphing calculator we can often approximate the slope of a function at a point by zooming in on the point until the graph begins to look like a line. For example, if we wish to find the slope of the curve y=x^2+2x at the point (2,8), we can ask our calculator to graph that curve and then trace the graph until we are on are near the point (2,8). If we then zoom in on that point, the screen of the calculator should begin to look like the picture below
Or we can create this window directly by setting the window of the calculator as
XMIN = 1.9
XMAX = 2.1
YMIN = 7.4
YMAX = 8.6
To find the slope of this curve, we merely need another point, so the tracing function (on a TI calculator) will give us a point on the curve such as (1.9900, 7.9401). Once we have this other point, we are ready to compute a slope:
m= (8-7.9401)/(2-1.9900 = (0.0591)/(0.0100 = 5.91.
So the slope of the curve y=x^2+2x at the point P(2,8) is probably about six.
Function notation
A function f on the real line is a mapping from the set of real numbers into the set of real numbers such that each input has a unique output.It is traditional to use x to label the inputs and y to label the output and write y=f(x) to indicate that y is the result of plugging in x to the function f. (We do not have to follow this tradition; we will, from time to time, use other letters to indicate inputs to a function or the output of a function.)
Our textbook by Rogawski reviews functions in section 1.1. Another good source for function review is the online notes by Dr. Paul Dawkins, available here.
The linearization of a function at a point
We seek to replace the function f(x) near a point P(x0, y0) by a straight line, that is, by a linear function L(x) = mx+b where L(x) closely approximates $f(x)$ near $P.$If we know the slope of the function f(x) at P this is easy to do. We simply write out the equation for the line through P(x0,y0) with that slope.
For example, consider this problem from my notes:
This problem really just asks for the point-slope form of a line. Here is the solution.
We will use the point-slope form of a line throughout this class!
Here is a follow-up question (also from my lecture notes)
y-2 = (1/8)(x-4)
Plug in x=5 to get
y-2=(1/8)(5-4)=1/8
so
y = 2 + 1/8 = 2.125.
In our Lecture 1.2 (on Friday) we will look at rates of change, both the average rate of change (ARC) and the instantaneous rate of change (IRC).


The extra you exploration, the additional examples you can find to support and justify the thesis statement. While studying, make certain that you only collect info from credible sources, compared with Wikipedia. PaySomeoneToWriteMyPaper You can go by distinct scholarly article content, scientific journals, academic blogs, and so on.3 Come across the Most Relevant Illustrations.
ReplyDelete